Global Precipitation Measurement (GPM)
A range of GPM products are provided by the pansat.products.satellite.gpm module.
[1]:
%load_ext autoreload
%autoreload 2
from datetime import datetime
t_0 = datetime(2016, 11, 21, 10)
t_1 = datetime(2016, 11, 21, 12)
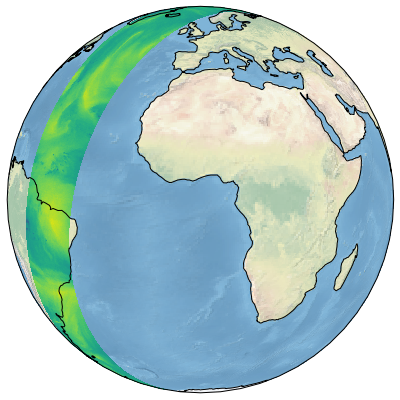
1C GMI remapped
The GMI 1C-R (remapped) product contains the brightness temperatures from the GMI sensor mapped to a common swath. The brightness temperatures of the different channels can be accessed via the tbs_1 and tbs_2 variables, which containg the lower and higher frequency channels, respectively.
[2]:
from pansat.products.satellite.gpm import l1c_gpm_gmi_r
t_0 = datetime(2016, 11, 21, 10)
t_1 = datetime(2016, 11, 21, 12)
files = l1c_gpm_gmi_r.download(t_0, t_1)
[3]:
import numpy as np
from h5py import File
dataset = l1c_gpm_gmi_r.open(files[0])
lats = dataset["latitude"]
lons = dataset["longitude"]
tbs_1 = dataset["tbs_1"]
[4]:
import matplotlib.pyplot as plt
from matplotlib.cm import get_cmap
from matplotlib.colors import Normalize
from matplotlib.gridspec import GridSpec
import cartopy.crs as ccrs

cmap = get_cmap("magma")
cmap.set_bad("grey")
norm = Normalize(100, 300)

gs = GridSpec(1, 2, width_ratios=[1.0, 0.05])
fig = plt.figure(figsize=(8, 8))
proj = ccrs.NearsidePerspective(central_longitude=lons.mean(),
                                central_latitude=lats.mean())
ax = plt.subplot(gs[0], projection=proj)
ax.stock_img()
ax.coastlines()
ax.pcolormesh(lons, lats, tbs_1[:, :, 1], transform=ccrs.PlateCarree(), norm=norm)
[4]:
<matplotlib.collections.QuadMesh at 0x7fe64bdc9590>
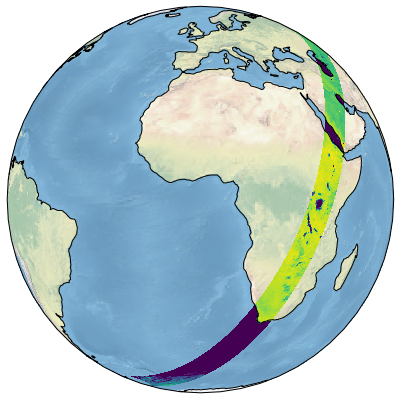
1C Metop-B MHS
The l1c_metopb_mhs product provides the calibrated brightness temperatures of the MHS sensor onboard Metop-B.
[5]:
from pansat.products.satellite.gpm import l1c_metopb_mhs
t_0 = datetime(2016, 11, 24, 10)
t_1 = datetime(2016, 11, 24, 12)
files = l1c_metopb_mhs.download(t_0, t_1)
[6]:
dataset = l1c_metopb_mhs.open(files[0])
lats = dataset["latitude"]
lons = dataset["longitude"]
tbs = dataset["tbs"].data
[7]:
import matplotlib.pyplot as plt
from matplotlib.cm import get_cmap
from matplotlib.colors import LogNorm
from matplotlib.gridspec import GridSpec
import cartopy.crs as ccrs

cmap = get_cmap("magma")
cmap.set_bad("grey")
norm = LogNorm(1e-3, 1e2)

gs = GridSpec(1, 2, width_ratios=[1.0, 0.05])
fig = plt.figure(figsize=(8, 8))
proj = ccrs.NearsidePerspective(central_longitude=lons.mean(),
                                central_latitude=lats.mean())
ax = plt.subplot(gs[0], projection=proj)
ax.stock_img()
ax.coastlines()
ax.pcolormesh(lons, lats, tbs[:, :, 2], transform=ccrs.PlateCarree())
[7]:
<matplotlib.collections.QuadMesh at 0x7fe648c9b690>
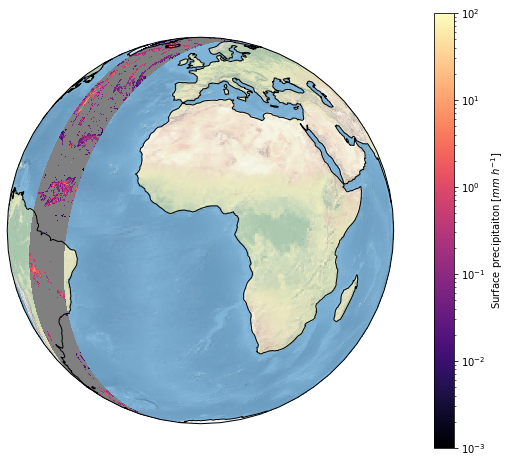
2A GPROF GMI
The level 2A GPROF product contains precipitation retrieved from the passive sensors of the GPM constellation. The l2a_gprof_gpm_gmi product provides the precipitation retrieved from teh GMI sensor onboard the GPM Core Observatory.
[10]:
from pansat.products.satellite.gpm import l2a_gprof_gpm_gmi
files = l2a_gprof_gpm_gmi.download(t_0, t_1)
[11]:
dataset = l2a_gprof_gpm_gmi.open(files[0])
lats = dataset["latitude"]
lons = dataset["longitude"]
precip = dataset["surface_precipitation"]
[14]:
import matplotlib.pyplot as plt
from matplotlib.cm import get_cmap
from matplotlib.colors import LogNorm
from matplotlib.gridspec import GridSpec
import cartopy.crs as ccrs

cmap = get_cmap("magma")
cmap.set_bad("grey")
norm = LogNorm(1e-3, 1e2)

gs = GridSpec(1, 2, width_ratios=[1.0, 0.05])
fig = plt.figure(figsize=(8, 8))
proj = ccrs.NearsidePerspective(central_latitude=lats.mean(),
                                central_longitude=lons.mean())
ax = plt.subplot(gs[0], projection=proj)
ax.stock_img()
ax.coastlines()
sm = ax.pcolormesh(lons, lats, precip, cmap=cmap, norm=norm, transform=ccrs.PlateCarree())

ax = plt.subplot(gs[1])
plt.colorbar(sm, cax=ax, fraction=0.4, pad=0.2, label="Surface precipitaiton [$mm\ h^{-1}$]")
plt.show()
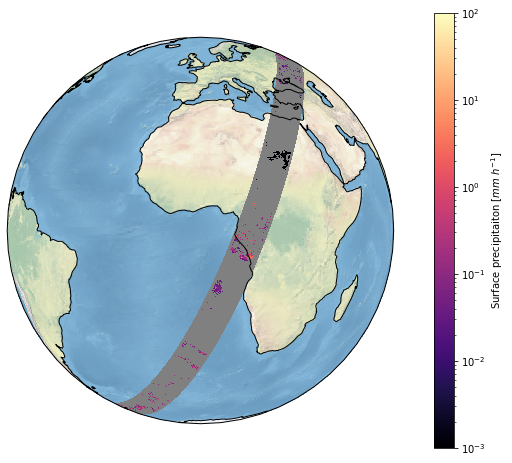
2A GPROF Metop-B MHS
The l2a_gprof_metopb_mhs product provides the precipitation retrieved from the MHS sensor onboard the Metop-B satellite.
[17]:
from pansat.products.satellite.gpm import l2a_gprof_metopb_mhs
files = l2a_gprof_metopb_mhs.download(t_0, t_1)
[18]:
dataset = l2a_gprof_gpm_gmi.open(files[0])
lats = dataset["latitude"]
lons = dataset["longitude"]
precip = dataset["surface_precipitation"]
[19]:
import matplotlib.pyplot as plt
from matplotlib.cm import get_cmap
from matplotlib.colors import LogNorm
from matplotlib.gridspec import GridSpec
import cartopy.crs as ccrs

cmap = get_cmap("magma")
cmap.set_bad("grey")
norm = LogNorm(1e-3, 1e2)

gs = GridSpec(1, 2, width_ratios=[1.0, 0.05])
fig = plt.figure(figsize=(8, 8))
proj = ccrs.NearsidePerspective(central_latitude=lats.mean(),
                                central_longitude=lons.mean())
ax = plt.subplot(gs[0], projection=proj)
ax.stock_img()
ax.coastlines()
sm = ax.pcolormesh(lons, lats, precip, cmap=cmap, norm=norm, transform=ccrs.PlateCarree())

ax = plt.subplot(gs[1])
plt.colorbar(sm, cax=ax, fraction=0.4, pad=0.2, label="Surface precipitaiton [$mm\ h^{-1}$]")
plt.show()